Region connectivity graphs in Python [edit: minor bug]
[edit] Nowadays you can find much better implementations of this over at scikit-image.[/edit]
Recently I started playing with CRFs on superpixels for image segmentation.
While doing this I noticed that Python has very little methods for morphological operations on images. For example I did not find any functions to exctract connected components inside images.
For CRFs one obviously needs the superpixel neighbourhood graph to work on and I didn't find any ready made function to obtain it.
After some pondering, I came up with something. Since I didn't find anything else online
I thought I'd share it.
First, the unique labels are mapped to [1,..,num_labels] (which is not strictly necessary but I ran into problems since my labels were huge).
Then I create "down" and "right" edges using a technique I saw at scikits.learn. I stack the edges and sort them, then hash them and find unique edges.
[edit] I also remove self-connections. Missed that on the first try. [/edit]
Hashing is necessary since "unique" only works on numbers. I could also have used a set, I guess.
Then I undo the hash and I'm done.
I find this code to be pretty fast and I thought it would be a lot more work to do this.
Numpy makes stuff so easy :) - I love it.
Now we want to visualize our graph. I start from the label-image in grid and [vertices, edges]:
And done.
Give it a try together with quickshift.
Recently I started playing with CRFs on superpixels for image segmentation.
While doing this I noticed that Python has very little methods for morphological operations on images. For example I did not find any functions to exctract connected components inside images.
For CRFs one obviously needs the superpixel neighbourhood graph to work on and I didn't find any ready made function to obtain it.
After some pondering, I came up with something. Since I didn't find anything else online
I thought I'd share it.
def make_graph(grid):
    # get unique labels
    vertices = np.unique(grid)

    # map unique labels to [1,...,num_labels]
    reverse_dict = dict(zip(vertices,np.arange(len(vertices))))
    grid = np.array([reverse_dict[x] for x in grid.flat]).reshape(grid.shape)

    # create edges
    down = np.c_[grid[:-1, :].ravel(), grid[1:, :].ravel()]
    right = np.c_[grid[:, :-1].ravel(), grid[:, 1:].ravel()]
    all_edges = np.vstack([right, down])
    all_edges = all_edges[all_edges[:, 0] != all_edges[:, 1], :]
    all_edges = np.sort(all_edges,axis=1)
    num_vertices = len(vertices)
    edge_hash = all_edges[:,0] + num_vertices * all_edges[:, 1]
    # find unique connections
    edges = np.unique(edge_hash)
    # undo hashing
    edges = [[vertices[x%num_vertices],
              vertices[x/num_vertices]] for x in edges]

    return vertices, edges
This code assumes a grid is given to it with uniquely labeled connected components.First, the unique labels are mapped to [1,..,num_labels] (which is not strictly necessary but I ran into problems since my labels were huge).
Then I create "down" and "right" edges using a technique I saw at scikits.learn. I stack the edges and sort them, then hash them and find unique edges.
[edit] I also remove self-connections. Missed that on the first try. [/edit]
Hashing is necessary since "unique" only works on numbers. I could also have used a set, I guess.
Then I undo the hash and I'm done.
I find this code to be pretty fast and I thought it would be a lot more work to do this.
Numpy makes stuff so easy :) - I love it.
Now we want to visualize our graph. I start from the label-image in grid and [vertices, edges]:
# compute region centers:
gridx, gridy = np.mgrid[:grid.shape[0], :grid.shape[1]]
centers = dict()
for v in vertices:
    centers[v] = [gridy[grid == v].mean(), gridx[grid == v].mean()]

# plot labels
plt.imshow(grid)

# overlay graph:
for edge in edges:
    plt.plot([centers[edge[0]][0],centers[edge[1]][0]],
             [centers[edge[0]][1],centers[edge[1]][1]])
And done.
Give it a try together with quickshift.


while the vim conceal feature is nice, you should make sure to turn it off before copying code from the terminal:
ReplyDeletefor edge ∈ edges should say for edge /in/ edges :-)
There are two useful functions in this regard:
ReplyDeletescipy.ndimage.labels, for connect components on images;
scipy.sparse.cs_graph_components for connect components on graphs
i have implemented a pure python version of slic using this region graph.
ReplyDeletehttp://beiervision.blogspot.de/2012/12/slic-superpixels.html
Hey Thorsten. That's pretty cool :)
ReplyDeleteI made a Cython version for scikit-image: http://peekaboo-vision.blogspot.de/2012/09/segmentation-algorithms-in-scikits-image.html
Somehow the compactness-tradeoff is not right, though. Did you have any problems with that? Somehow it depends a lot on the image size in my implementation :(
So far i did not compared to the orginal impl.
DeleteBut i will do that the next days and report my results to you.
I think i have no problems with compactness tradeoff.
DeleteSeems to work as expected (but i switched to my own c++ version which will be brought to python with boost python in a few days)
seems to me that u are not handling the orphan correctly?
DeleteOr do you do post-processing at all?
No, there is no orphan post-processing. Yeah, I should add that (there are simple functions for that in skimage). But that doesn't really concern the compactness, does it?
DeleteIf i set m to low values a get a lot of orphans and also strange shaped regions.
ReplyDeleteBut the pictures at http://peekaboo-vision.blogspot.de/2012/09/segmentation-algorithms-in-scikits-image.html
look also strange to me.
As distance i use :
normalization=searchRadius*searchRadius
dist=sqrt( squaredColorDist + (squaredXYDist/normalization)*(m*m))
(the sqrt can is not necessary )
That is what they use in the pami paper (or say they use).
This comment has been removed by the author.
ReplyDeleteI guess it depends on what you want to do. I usually represent the graph either as a scipy sparse matrix or just as a list of edges. When I need to do something to the superpixels, mostly use the superpixel image. I hope to soon share my code on image segmentation.
DeleteI assume blog owner can see deleted message. I deleted as I was fumbling my way through and didn;t really want to bother you.
DeleteAnyway, if you are interested, I have RGB image and a depth map. The intuition is that I combine superpixels based on similar depth features average depth, surface normal, and perhaps average angular difference between neighboring segments.
At the moment I am wrestling trying to understand how I can combine/join segments. I might have to end up using a graph library.
Anyway, thanks again for the blog. I am finding it very useful.
Yeah, I saw that you deleted your comment ;)
DeleteI'm glad you find the blog useful, have done way to little recently. If you only need to join the superpixels and don't need the graph any more, you can just set set one indicator to the value of the other. If you do need to keep the graph, a graph library might indeed be the easiest way to go (if it doesn't need to be fast, use networkx)
Setting one indicator to another seems like a simple solution. I like simple solutions. I guess need some way to keep track of this relabeling. For example assume S1+S2 are joined and indicator set say to lowest value. Later S2+S5 need to be joined, so will need to take on same label as S1+S2. Anyway, starting to ramble.
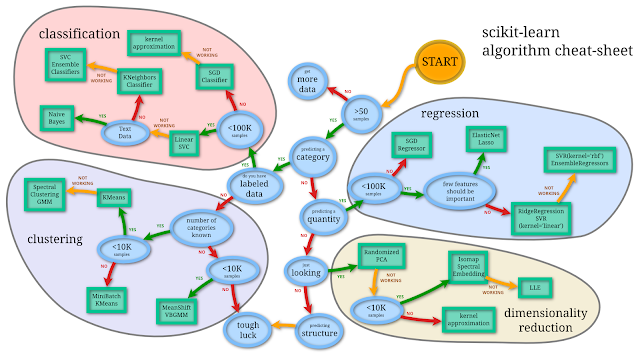
DeleteOnce I have joined the superpixels I need to learn which are interesting. I will generate a feature vector, some test/train data and feed this into a scikit-learn workflow. Get to use you machine learning cheat sheet.
Thanks for you help.
If you use bag of words of SIFT descriptors and Color histograms (which work well for me), I suggest you try the AdditiveChi2Sampler together with LinearSVC or SGD. If you have many examples, you can compute the bag of words with MiniBatchKMeans. I should really publish my code ^^
DeleteThanks for the pointers.
DeleteHello Andreas,
ReplyDeleteI'm making a python program that performs the classification of objects, these objects are the result of a segmentation QuickShift or Slic, and the features that I have that is the calculation of Mean difference to neighbors.
Have any recommendations that can help me to perform the calculation.
Hey Salim.
DeleteWhat exactly do you mean by classification? Is it a supervised learning task? Why do you use the mean difference to neighbors as features? Without knowing about the task, it is hard to say if this will help you.
Andy
Hey Andreas,
ReplyDeleteAfter I get the image segmentation results in a segmented image that represents a set of objects, therefore of these objects I have to calculate a number of features that can be spatial or morphological or spectral. One of these features is mean difference to neighbors, because is a spacial feature.
Salim
The task is talking about the caracterizacion of a image object, so i have a image object and i want to calculate some feature as area, centroid, density mean difference to neighbors etc ..
ReplyDeleteAnd i want to knhow if there is some method to calculate
Deletethe border length between two image objects (relation between two image objects v and u is the total number of the elementary pixel borders along the common border)
Salim
My project partner and I were struggling so much while trying to figure out a way to connect superpixel segments for our algorithm. This REALLY helped. Thanks a ton! :D
ReplyDeleteI'm glad. By now, there is an implementation over at scikit-image: http://scikit-image.org/docs/dev/auto_examples/segmentation/plot_rag_draw.html
Delete