Machine Learning Cheat Sheet (for scikit-learn)
As you hopefully have heard, we at scikit-learn are doing a user survey (which is still open by the way).
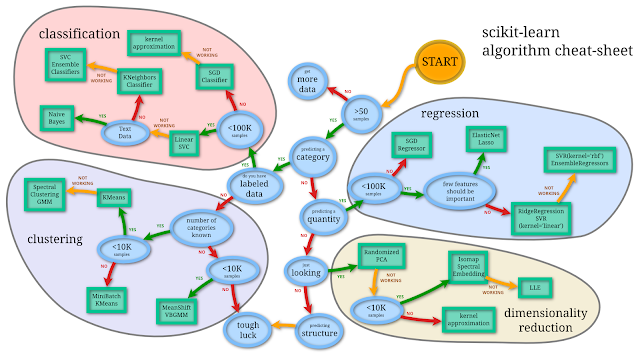
One of the requests there was to provide some sort of flow chart on how to do machine learning.
As this is clearly impossible, I went to work straight away.
This is the result:
[edit2]
clarification: With ensemble classifiers and ensemble regressors I mean random forests, extremely randomized trees, gradient boosted trees, and the soon-to-be-come weight boosted trees (adaboost).
[/edit2]
Needless to say, this sheet is completely authoritative.
Thanks to Rob Zinkov for pointing out an error in one yes/no decision.
More seriously: this is actually my work flow / train of thoughts whenever I try to solve a new problem. Basically, start simple first. If this doesn't work out, try something more complicated.
The chart above includes the intersection of all algorithms that are in scikit-learn and the ones that I find most useful in practice.
Only that I always start out with "just looking". To make any of the algorithms actually work, you need to do the right preprocessing of your data - which is much more of an art than picking the right algorithm imho.
Anyhow, enjoy ;)
[edit3]
You can find the SVG and dia file I used here. I doubt this qualifies as a creative work, but to make, I put this under CC0 license, which translates to "public domain" in the US.
[/edit3]
[edit]
As some people commented about structured prediction not being included in the chart: There is SVMstruct, which is a great library and has interfaces to many languages, but is only free for non-comercial use.
There is also the library I'm working on, pystruct, which I will write about on another day ;)
The chart is not really comprehensive, as I focused on scikit-learn. Otherwise I certainly would have included neural networks ;)
[/edit]
One of the requests there was to provide some sort of flow chart on how to do machine learning.
As this is clearly impossible, I went to work straight away.
This is the result:

[edit2]
clarification: With ensemble classifiers and ensemble regressors I mean random forests, extremely randomized trees, gradient boosted trees, and the soon-to-be-come weight boosted trees (adaboost).
[/edit2]
Needless to say, this sheet is completely authoritative.
Thanks to Rob Zinkov for pointing out an error in one yes/no decision.
More seriously: this is actually my work flow / train of thoughts whenever I try to solve a new problem. Basically, start simple first. If this doesn't work out, try something more complicated.
The chart above includes the intersection of all algorithms that are in scikit-learn and the ones that I find most useful in practice.
Only that I always start out with "just looking". To make any of the algorithms actually work, you need to do the right preprocessing of your data - which is much more of an art than picking the right algorithm imho.
Anyhow, enjoy ;)
[edit3]
You can find the SVG and dia file I used here. I doubt this qualifies as a creative work, but to make, I put this under CC0 license, which translates to "public domain" in the US.
[/edit3]
[edit]
As some people commented about structured prediction not being included in the chart: There is SVMstruct, which is a great library and has interfaces to many languages, but is only free for non-comercial use.
There is also the library I'm working on, pystruct, which I will write about on another day ;)
The chart is not really comprehensive, as I focused on scikit-learn. Otherwise I certainly would have included neural networks ;)
[/edit]


"looking for structure" leads to "tough luck". I notice that program learning doesn't appear anywhere on the chart. Am I missing something?
ReplyDelete(Disclaimer: I work on a program learning system, to learn structure.)
I don't really know about program learning. The reason that "looking for structure" leads to "tough luck" is 1) I only listed algorithms that are implemented in sklearn 2) if you need a flow-chart to know what to do, I don't think you will be successful in working with structured models ;)
DeleteFucking awesome.we need this in the scikit-learn documentation. This is an SVG edited with inkscape, right?
ReplyDeleteI started out with dia and then did some modifications in inkscape. You can find both files here: https://gist.github.com/4642976 :)
Deletehi please give me any simple problem for doing ph.d in svm
DeleteSweet ! ... Comprehensive indeed. Thanks!
ReplyDeleteIs this based on eh... data?
ReplyDeleteWhich part do you mean? Most arrows tell you which class of algorithms to use. Mean shift doesn't take the number of clusters as parameter. That is a fact and doesn't need data.
DeleteThat stochastic and online algorithms scale to more data is based on runtime analysis. The number that I choose for branching is just a rule of thumb and naturally depends on the problem at hand.
The sequence of algorithms (Linear SVM -> KNN -> SVM)
is based on runtime complexity, the simplicity of the algorithm (you can read that as VC dimension if you want), the robustness and the ease of use.
So as far as I can see, the most arbitrary choice I did was which algorithms to include. As I said, that was governed by the availability in scikit-learn and my personal experience.
If you want more data, maybe look at the top then algorithms in data mining: http://www.cs.uvm.edu/~icdm/algorithms/10Algorithms-08.pdf they mostly select the same algorithms as I did (in areas that both they and me covered)
This is nice. For ease of reading, it would have been better to be consistent in choice of ">" or "<"
ReplyDeleteTrue. Well, I did that for all the important ones downstream, but missed the >50 one :-/
DeleteWhy is the random forest technique not in this graph ?
ReplyDeleteIt is. Only not very explicit. I'll correct this. The ensemble classifiers and ensemble regressors refer to Random forest, extremely randomized trees and gradient boosted trees (and weight boosted trees as soon as they are added).
DeleteGreat! Very helpful.
ReplyDeleteThank you.
Thanks for posting this! As someone with a programming background but not really a machine learning background this is quite helpful.
ReplyDeleteGreat effort, Thanks for sharing with all
ReplyDeleteVery nice. imho, there should be some consideration for the dimensionality and sparsity of the data, not just number of samples. In many (non-kernel based) algorithms, such as least squares regression, dimensionality is the limiting factor, and you only need to be able to make a single pass over the data.
ReplyDeleteYou are right, there are many other factors to consider. Clearly this is just a very rough guide.
DeleteIn my personal experience, I have never had a problem with large numbers of features. But that obviously depends on you setting. I worked with image data, where there are usually <10k features, and text data, which is very sparse.
Couldn't DBSCAN be used in the instance within clustering --> unknown number of categroies --> under 10K samples? Also, how do you know the order of magnitude of the sample size needed in all of these cases?
ReplyDeleteThanks :)
Yes, DBSCAN could be used there. I am not very experienced with that algorithm, though, and therefore it would not be my first choice - maybe it should be ;)
DeleteThere is now way to tell how many samples you need.
The number of samples are estimates where the algorithms are computationally feasible. If you try to run a kernel SVM on 500k samples, you will probably wait a week (if not run out of memory first) and then see that you didn't choose the right bandwidth gamma.
The <50 is a pretty arbitrary lower limit. Someone on reddit suggests "call a statistician" instead of getting more data, which definitely is an alternative. This is not really the regime for which these algorithms were designed.
Actually DBSCAN with a good index (k-d-tree, r-tree) should scale well into the millions of objects.
DeleteIf you were going to include neural networks on your chart, about where would you put them?
ReplyDeleteMy first impulse would be to put them into the SVC/SVR and ensemble method boxes for classification and regression. But actually they scale even to very large datasets.
DeleteArguably they are a bit harder to get right than SVMs and random forests. So maybe there would be arrows going from SVMs and kernel approximation going to NNs.
Hi,
ReplyDeleteCool chart and info! Which tool did you use to create the chart?
Thanks!!
Dia and Inkscape, though I wasn't very happy with that.
DeleteAwesome...two paws up!
ReplyDeleteNow make this into a (meta-)algorithm
ReplyDeleteThis is very interesting. But when an algorithm does not work, we can also try different ways to normalize the data before switching to another algorithm. Sometimes normalization helps a lot.
ReplyDeleteThis is totally useful for those of us who are getting started with kaggle.com competitions, thanks for making it!
ReplyDeleteGreat info!! :)
ReplyDeleteI have a problem though, despite of looking the picture...
I want to use any algorithm from weka at the following problem, but I do not know how should I preprocess my data, or one running well algorithm.
I have some data of the houses, like their size(in square meters), if they use aircondition, how many residents live in, I have their electricity consumption as well. I want to train any Machine Learning Algorithm to the dataset above, in order to create a model that estimates the houses consumption.
I tried many different algorithms (using weka), but I did not have good results. I was said that SVMs could solve this problem, with the right preprocessing. However, i did not have good results either.
Can anyone help me, in the way i should approach this problem, because I am really stuck?
Thanks in advance
I guess being bayesian is the tough luck case.. :P
ReplyDeleteHi,
ReplyDeleteI have a very big and resourceful data on an e-commerce site I run and I wanted to group my clients into frequency buyers and discover groups of preferences among them. I have some categories of products and they buy on one or more categories.
So far, most machine learning algorithms are explained in depth mathematically wise. But i am having trouble transforming my data into something to feed these algorithms.
In your post you said that preprocessing data is an art. Where can I read something useful to guide me through that ?
thanks in advance,
Bruno
Hi Bruno. Unfortunately I don't know of any good resources on preprocessing. My best guess would be "Machine learning for Hackers", as this is more geared towards the practitioner. I haven't read it, though, and it is for R.
DeleteI heard rumors of some machine learning guru working on a scikit-learn book, that would also be more on the practical side. Not sure if this would come out this year, though.
For the moment, my best advise would be to get a machine learner / data scientist to work with you ;)
Cheers,
Andy
This is awesome and helpful.
ReplyDeleteBy the way, what do you mean by "just looking", and why did it go to the dimension reduction? Does it mean that you only want have a overview on the data?
Basically I use dimensionality reduction and manifold learning mainly for visualization. I project down to 2 dimensions and then do a scatter plot.
DeleteIn the lower left 'clustering' blob, the rightmost '<10K' question has 'yes' pointing to "Meanshift VBGMM", and 'no' to "Tough luck". Shouldn't that be the other way around? :)
ReplyDeleteErrr... no? With few examples you can do something, with more it is harder (though DBSCAN might do it, not in sklearn currently though).
DeleteHello, This was very very helpful.By right processing of data can u please explain what do you mean by that because currently I am working on Text classification using Linear Regression . I have 20 categories . I am confused how my dataset should be . Can you please explain that part ? Thanks in advance
ReplyDeleteMeanShift should scale well beyond 10k samples. I've used it on datasets with millions of samples (you need to use bin_seeding). Disclaimer: I sped up the meanshift implementaion a few years ago, so I'm slightly offended to see you label it as only appropriate for <10k samples :-)
ReplyDeleteOh, I'm sorry. Maybe I used the old implementation :-/ we should have an example of large-scale clustering in sklearn! If I find time, I'll play around with it.
DeleteThanks for posting this! As someone with a programming background but not really a machine learning background this is quite helpful.
ReplyDeleteGreat post. What are the advantages to trying Linear SVC before Naive Bayes when working with Text Data?
ReplyDeleteThanks :)
DeleteYou got me, there is not really a reason. Probably the take-away message is that I just try Linear SVC before thinking about the problem at all ;)
Naive Bayes might be a more natural first choice, but would make the graph slightly more complicated (It would have Linear SVC in two places). I would say I'd prefer algorithms that are less sensitive to hyper-parameters more but I have too little experience with NB to know if it is more sensitive to alpha than LinearSVC is to C.
Awesome
ReplyDeleteThis looks very similar to the map described on dlib C++ Machine Learning library page. http://dlib.net/ml_guide.svg
ReplyDeleteYeah, Daniel said he liked the idea so he created one for his lib, too :)
DeleteIt would have been better if you had drawn this from a flow chart tool like creately for the tutorial. Its ok though! Thanks for sharing..
ReplyDeleteIt is drawn with a flow chart tool, dia ;)
DeleteThis comment has been removed by the author.
ReplyDeleteThis comment has been removed by the author.
ReplyDeleteJust found this, please contribute these diagrams to creately diagram community.
ReplyDeleteEverytime i want to use mglearn.discrete_scatter(X[:, 0], X[:, 1], y) to plot on my own data set whihc is made up of 17 features and target variable 0 & 1, i keep getting this error:
ReplyDeleteline 42, in mglearn.discrete_scatter(X[:, 0], X[:, 1], y_train)
File "C:\Users\DeJavu\Anaconda2\lib\site-packages\pandas\core\frame.py", line 2062, in __getitem__
return self._getitem_column(key)
File "C:\Users\DeJavu\Anaconda2\lib\site-packages\pandas\core\frame.py", line 2069, in _getitem_column
return self._get_item_cache(key)
File "C:\Users\DeJavu\Anaconda2\lib\site-packages\pandas\core\generic.py", line 1532, in _get_item_cache
res = cache.get(item)
TypeError: unhashable type
If you have issues with mglearn, please use the mglearn issue tracker: https://github.com/amueller/mglearn
DeleteWhat's the type of X[:, 0], X[:, 1] and y? These are supposed to be numpy arrays of float.
(y is supposed to be integer)
Delete